Debugging standalone JS files in VSCode

As a Senior Principal Engineer at CVSHealth, I specialize in building and optimizing cvs.com to deliver a superior guest experience. Using the latest web technologies, my team and I work diligently to create a user-friendly and intuitive platform that exceeds expectations.
You have most likely used VSCode if you have been doing web development for some time. I switch between WebStorm and VSCode for my company’s projects but I have started to prefer VSCode more since it has a much faster boot time.
Recently, I ran into an issue when I just wanted to test a simple script file and wanted to debug it as I wrote it. I could of course use the Chrome debugger but this needed some more work 🤷♂
Anyways, I didn’t want to do this over and over again and wanted to set this up in a way that it works across projects on my system.
Here is how I did it:
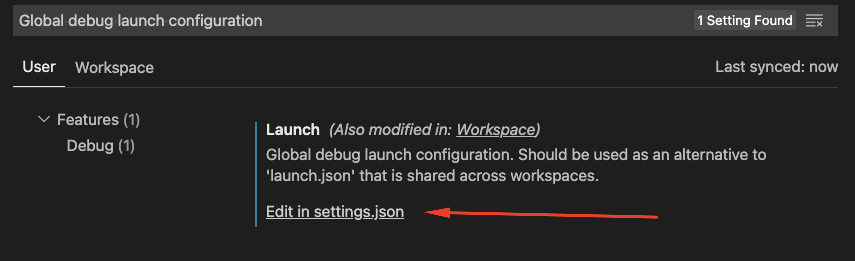
Press
Cmd + ,(orCtrl + ,for Windows) to get into the Settings pageSearch for
Global debug launch configurationClick on
Edit in settings.json
- Add the following configuration under
launch
"launch": {
    "inputs": [],
    "configurations": [
      {
          "type": "node",
          "request": "launch",
          "name": "Launch Current Opened File",
          "program": "${file}"
      }
    ],
    "compounds": []
  }
And you’re all set !
Go back to your JS file and hit F5 . Any breakpoints will let you debug variables from here on.
Enjoy debugging 👋